At the South San Francisco Chamber of Commerce, we are always looking for new ways to enrich the city’s quality of life and bring people together to build a sense of community. The presence of nearby recreation areas provides opportunities for outdoor activity and socialization, and the city’s parks contribute to physical and psychological health. Community events such as art fairs, Halloween parades, and concerts in the park foster social and cultural enrichment for everyone.
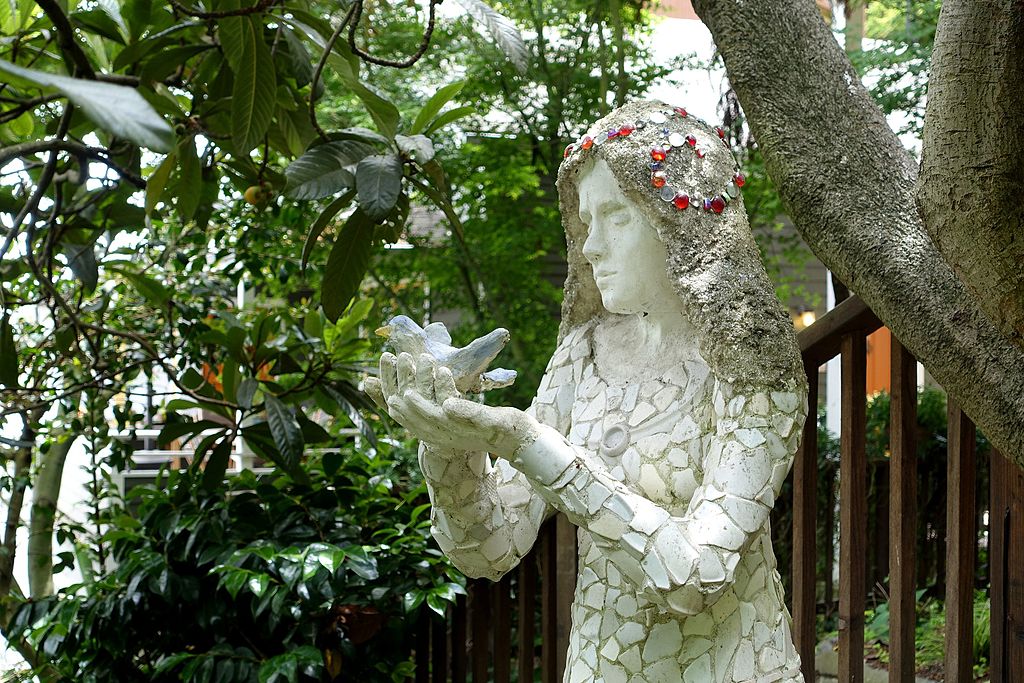
The city's Sculpture Garden showcases public art which defines safeguards and celebrates public space and the identity of the community. Public art beautifies and enhances the landscape while bringing us all together.
Image by: Daderot, CC0, via Wikimedia Commons